

What is Statistics?
Statistics is the science of collecting, analyzing, and interpreting data in order to make decisions.For Example
Say that you jog daily morning, and now you plan to record your jogging time.
After
\(10\)
days, your records are \(25\)
min, \(30\)
min, \(35\)
min, \(20\)
min, \(25\)
min, \(40\)
min, \(30\)
min, \(30\)
min, \(25\)
min, \(40\)
min Now You ask,
• What is the maximum jogging time?
We can see that the maximum jogging time is\(40\)min, congrats you got it this is statistics
• What is the minimum jogging time?
We can see that the maximum jogging time is\(20\)min, congrats you got it this is statistics
• What is the average jogging time?
Average jogging time is\(\frac{25 + 30 + 35 + 20 + 25 + 40 + 30 + 30 + 25 + 40}{10}=\)\(30\)min, congrats you got it this is statistics
What is Statistics (by Sir Michael I. Jordan)

Let's see an example where statistics is used in real-life.
See this New York Times article, here it is claimed that,
"TheseThey claim to have\(\$250\)running shoes will make you run faster"
\(500,000\)
data points of running time for different shoes.Are
\(500,000\)
data points sufficient? What if there are 5Million or say 50Million data points! We can answer this question using statistics and we'll understand more about it in upcoming chapters. Data comes from a random process.The goal of statistics is to extrapolate from a finite number of observations to what we can get if we had an
They aren't just a sequence of numbers, and those numbers are representative of that random process.
\(\infty\)
amount of observation. If we have an \(\infty\)
amount of data we can describe a random process (but there still be some randomness), and this process helps us to make a prediction.To understand randomness, we need Probability..
Probability
Here, we have a description of a random process and we are asked about the outcome from that random process, like expectation, probability distribution, etc.Now the question is where does Statistics fit in all of this?.
We don't need statistics to understand that, a fair dice has
\(\frac{1}{6}\)
chance to outcome a 1 OR a fair coin has \(\frac{1}{2}\)
chance to outcome a heads.But what if we don't know about that random process, then we need statistics to figure it out.What if the coin isn't fair?
We flip a coin, collect the number of Heads and Tails and calculate proportion of Heads and see that "Is probability converging 1/2?"
Sometimes there is real randomness like a biased coin, measurement error, etc.
For Example
• Flipping a coin
When we flip a coin then every flip in itself is random, coins had no freewill to land either Heads or Tails• Measurement Error
No instrument is perfect, every instrument have some error, and this error is completely random, an instrument doesn't decide how much error it should produce, it's just random.
Sometimes there is no randomness, this is where most of the randomness comes from,
For Example
Say we have\(4\)types of food "Pizza","Pasta", "Hamburger" and "Rice".
We want to predict a person's favorite food among these\(4\).A single person's preference is not random, for him/her self.There is only one food which is your most favorite, and if I ask you about your favorite food 100 times, your answer will not change.
But for a statistician each person's favorite food is random.
In order to predict a person's favorite food we want some parameters like their Age, Gender, Locality, etc.
There are soo many parameters we can't even think about, so we can't tell their favorite food with\(100\%\)certainty, there will be some randomness.
So we pick parameters that we can collect and based on them we can give our prediction.So there is a huge component that we do not understand.
When we talk about genes we try to predict personalized medicines based on gene profiles. Gene profile tells a lot about some disease but not everything. So there are things that we don't understand, it's just not accessible to us.
Statistical Modeling
What will we do when we encounter a Complicated situation?We split the Complicated process into two parts, First is a simple process that we are able to understand, and the other one is Random Noise that we are not able to understand.
Example\(\text{Complicated Process} \equiv \text{Simple Process} + \underbrace{\text{Random Noise}}_{\text{Modelling assumption}}\)
Say we want to travel from Tokyo to India, so what should we do?
We book our tickets, pack our bags, then head over to India.
This is what we know, but what we don't know is.There is no certainty of these events happening, but there is a possibility. These events are what we are referring to, as Random Noise.
- What if seats are already full.
- What if our cab malfunctions.
- What if the flight gets delayed.
Good Modeling consists of choosing (plausible) simple process and noise distribution(modelling assumption).
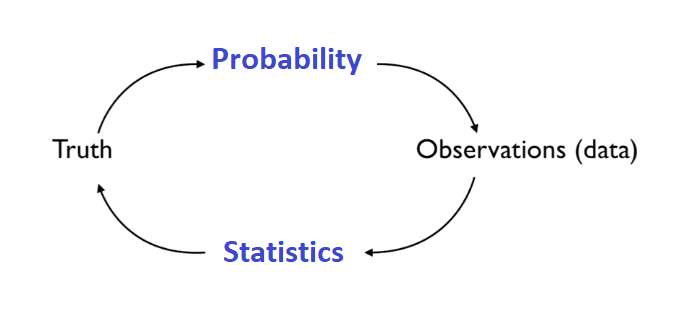 This is the Central Dogma of probability and statistics, it implies:
 We have a truth(Random Process) that generates data and probability will tell us what our data look like.For example: Say that we have our fair coin
\((p=0.5)\)
as truth, we don't know how it generates the sequence of heads and tails, all we see is a (random) sequence of heads and tails.If we don't know anything about the coin (like is it fair or not), then we use statistics to figure it out (with some level of confidence). Here we try to recover truth from the data.
The Counting Balls Example
Say we have a room full of Red balls and Blue balls.We want to determine among Red balls and Blue balls which of them have higher proportion, but we won't be able to count all the balls in the room as there are too many of them.
So instead what we do is, we took a small sample of balls from that room, then find the proportion of Red balls and Blue balls in that sample and hope that proportion we just estimated is somewhat near the True proportion(for the whole room).
So how can we tackle this problem?
Assume that our small sample have 90% of Red balls, then it's an indication that proportion of Red balls is higher than proportion of Blue balls.
But how to decide the cutoff (beyond which we can say 'Yes' proportion of Red balls is higher than proportion of Blue balls?).
What if the data states that in our sample 51% of the balls are Red balls, then can we say it is an indication that proportion of Red balls is higher than proportion of Blue balls?
What we want is to understand the true proportion of Red balls and Blue balls in the entire room.
Statistical experiment
Let,\(p\)
: Proportion of Red balls.\(n\)
: Total number of balls in our sample. \(\hat{p}\)
: estimator of \(p\)
.Here we assign
\(1\)
for Red ball and \(0\)
for Blue ballSo if we denoteSay we took a sample of\(i^{th}\)ball by\(B_i\)then,\(\sum_{i=1}^{n}B_i=\)Total number of Red balls in our sample.
is\(\frac{1}{n}\sum_{i=1}^{n}B_i\)is the proportion of Red balls in our sample.
\(n=300\)
balls and in that sample \(180\)
balls are Red so, \[\hat{p}=\frac{180}{300}=60\%\]
60% seems to be
\(\gt\)
50% but is it significantly larger then 50%?Say that we have only 3 data points.
- Will you be convinced if we have 3 Red balls (\(\hat{p}=100\%\))?
- Will you be convinced if we have 2 Red balls (\(\hat{p}=66.66\%\))?
\((n)\)
. \(n=3\)
is too small \(n=300\)
may be large enough, so what is the right number for \(n\)
?This question is important, What your sample size should be?
We can also ask that for
\(n=300\)
, what is the minimum number of Red balls that we want to convince ourselves, that proportion of Red balls is higher than proportion of Blue ballsEstimator
\[B_i=\left\{\begin{matrix} 1& \text{if the }i^{th}\text{ ball is Red}\\ 0& \text{if the }i^{th}\text{ ball is Blue} \end{matrix}\right. ;\quad i=1,...,n\]
\[\hat{p}=\overline{B}_n=\frac{1}{n}\sum^n_{i=1}B_i\]
\(\hat{p}\)
is the Sample average.Ok we got an estimator but what is it's Accuracy?
Accuracy of our estimator
\(\hat{p}\)
depends on sample size \(n\)
, \(3\)
balls aren't enough but \(300\)
balls might be enough. Accuracy of \(\hat{p}\)
also depends on true \(p\)
which we don't even know. We want to know how close is \(\hat{p}\)
to the true \(p\)
(this is where randomness comes into play). We think of
\(B_i\)
as random variables so \(\hat{p}\)
is also a random variable, \(\hat{p}\)
will tend to take some values \(\in [0,1]\)
.Modeling assumptions
Coming up with a model that consists of making assumptions on what those\(B_i\)
's are. So here are the assumptions that we made:\(1.\quad\)
Each \(B_i\)
is a random variable.Each ball draw is random, the ball can be a Red ball(with probability\(p\)) or a Blue ball(with probability\(1-p\)).
So every\(B_i\)is either 1(with probability\(p\)) or 0(with probability\(1-p\)), so\(B_i\)is a random variable.
\(2.\quad\)
Each \(B_i\)
is a Bernoulli random variable with parameter \(p\)
Every\(B_i\)is either 1(with probability\(p\)) or 0(with probability\(1-p\)).So\[B_i=\left\{\begin{matrix} 1& \text{if the }i^{th}\text{ ball is Red}\\ 0& \text{if the }i^{th}\text{ ball is Blue} \end{matrix}\right. ;\quad i=1,...,n\]\(B_i\)has no choice but to be a Bernoulli random variable.\[B_i\sim\text{Ber}(p)\]But wait there's a hidden assumption,
•\(p\)is same for every drawIt means for every draw, probability of drawing a Red ball is\(p\)and probability of drawing a Blue ball is\(1-p\).
So every Random variable\(B_i\)is Identically distributed.
\(3.\quad\)
\(B_1,B_2,...,B_n\)
are mutually independentEvery draw is an independent draw.
If we draw a Red ball then it gives us no information about our next draw, proportion of drawing a Red ball is still\(p\).
So we can say that\(B_1,B_2,...,B_n\)are mutually independent
Now let's see some Simulation, choose your language of choice,,
Launch Statistics App
Recommended Watching
What is Statistics (by ma'am Cassie Kozyrkov)
Analytics v/s Statistics (by ma'am Cassie Kozyrkov)
Are you Bayesian or Frequentist? (by ma'am Cassie Kozyrkov)
Why Statistics (by Sir Eric Newburger)